|
CHESTER COUNTY OBSERVATION WELL NETWORK - REPORT FOR
SEPTEMBER 2022
Levels Indicated are Depth to Water in Feet Below Land Surface |
Well
Number |
Municipal
Location |
Current Month
Depth to Water
and Current Status
|
Reference Data for Current Status |
Drought Emergency |
Drought Warning |
Drought Watch |
Median |
CH 2* |
Honey Brook |
10.96 |
Below Median |
12.97 |
12.07 |
11.50 |
10.65 |
CH 38* |
New Garden |
12.74 |
Drought Watch |
13.26 |
12.79 |
12.56 |
10.38 |
CH 210 |
Tredyffrin |
23.84 |
Below Median |
26.19 |
25.79 |
25.07 |
23.20 |
CH 254 |
East Nottingham |
22.91 |
Below Median |
27.55 |
26.50 |
24.24 |
22.44 |
CH 1201 |
West Sadsbury |
5.73 |
Above Median |
7.80 |
7.30 |
6.79 |
6.18 |
CH 1229*^ |
Upper Uwchlan |
35.25 |
Above Median |
37.47 |
36.97 |
36.06 |
35.38 |
CH 1247* |
West Vincent |
27.63 |
Above Median |
33.69 |
33.29 |
32.23 |
30.70 |
CH 1387 |
Thornbury |
35.06 |
Above Median |
37.57 |
36.63 |
36.13 |
35.19 |
CH 1571 |
East Vincent |
9.69 |
Above Median |
11.09 |
10.75 |
10.56 |
10.25 |
CH 1921 |
New Garden |
43.11 |
Above Median |
48.68 |
48.47 |
45.89 |
42.95 |
CH 2273 |
West Brandywine |
2.69 |
Drought Watch |
4.43 |
3.31 |
2.19 |
1.01 |
CH 2313 |
East Whiteland |
12.81 |
Drought Watch |
15.47 |
14.17 |
11.91 |
10.12 |
CH 2328 |
East Nantmeal |
3.03 |
Above Median |
5.70 |
5.09 |
4.54 |
3.69 |
CH 2457 |
East Goshen |
20.84 |
Above Median |
23.55 |
23.10 |
22.72 |
21.92 |
CH 2561 |
Charlestown |
89.10 |
No Statistics |
XXX |
XXX |
XXX |
XXX |
CH 2584 |
East Marlborough |
23.16 |
No Statistics |
XXX |
XXX |
XXX |
XXX |
CH 3289 |
Tredyffrin |
20.22 |
Above Median |
31.39 |
30.46 |
27.93 |
25.24 |
CH 5422 |
Londonderry |
19.88 |
No Statistics |
XXX |
XXX |
XXX |
XXX |
CH 6513 |
North Coventry |
17.25 |
No Statistics |
XXX |
XXX |
XXX |
XXX |
CH 6516 |
Pennsbury |
3.41 |
No Statistics |
XXX |
XXX |
XXX |
XXX |
CH 6517 |
West Caln |
64.54 |
No Statistics |
XXX |
XXX |
XXX |
XXX |
CH 6518 |
Lower Oxford |
22.70 |
No Statistics |
XXX |
XXX |
XXX |
XXX |
CH 7007 |
Wallace |
33.56 |
No Statistics |
XXX |
XXX |
XXX |
XXX |
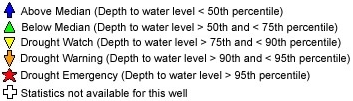
Current Status Explanation
Above Median - Depth to water level < 50th percentile
Below Median - Depth to water level > 50th and < 75th percentile
Drought Watch - Depth to water level > 75th and < 90th percentile
Drought Warning - Depth to water level > 90th and < 95th percentile
Drought Emergency - Depth to water level > 95th percentile
No Statistics - Statistics not available for this well
Median shows the middle of the distribution and is less sensitive to extreme water levels, so it is more typical than the mean.
|
XXX = statistic not available for this well |
*wells monitored for the Christina Basin Drought Management Plan |
^Recent activity at the well site may have altered the hydrologic conditions as they apply to the drought triggers. |
|
Wells CH 2273, CH 2328 and CH 6516 can have ground water levels above the land surface
(known as an artesian well); a (-) sign indicates a water level above the land surface. |
|
Percentiles shown were revised as of
May 31, 2006 to reflect updated statistical analysis reported in
the U.S. Geological Survey report DS-292.
|
|
Date Prepared:
9/23/22
|